Gauley River at Above Belva, WV
USGS gauge 03192000 · drainage 1,316 sq mi · observed Oct 16, 9:00 PM EDT · 80 min old
Weather alerts Official NWS
Freeze Watch issued October 16 at 4:25PM EDT until October 18 at 9:00AM EDT by NWS Charleston WV
Ends Oct 18, 9:00 AM EDT
Source: National Weather Service alerts for the gauge location, fetched Oct 16, 10:17 PM EDT.
Last 7 days Live gauge
Source: USGS Water Data API (continuous values), observed to Oct 16, 9:00 PM EDT. Shaded band: 25th to 75th percentile of USGS daily statistics for each date; dashed: median. Flow in cfs.
Gage height and flood stages Live gauge
| Measure | Gage height | Note |
|---|---|---|
| Latest gage height | 2.80 ft | Oct 16, 9:00 PM EDT |
| Action stage | 18.0 ft | 15.2 ft above the latest gage height |
| Minor stage | 20.0 ft | 17.2 ft above the latest gage height |
| Moderate stage | 24.0 ft | 21.2 ft above the latest gage height |
| Major stage | 27.0 ft | 24.2 ft above the latest gage height |
Source: USGS Water Data API (continuous gage height), observed to Oct 16, 9:00 PM EDT. Flood stages from National Weather Service forecast point BVAW2. Dashed horizontal lines are drawn only where they fall inside the axis; all stages are in the table.
Gauge location Mapped layer
Source: Map services and data available from U.S. Geological Survey, National Geospatial Program (USGS Topo). Map about 10 miles across, centred on the gauge at 38.2334, -81.1809.
Radar Official NWS
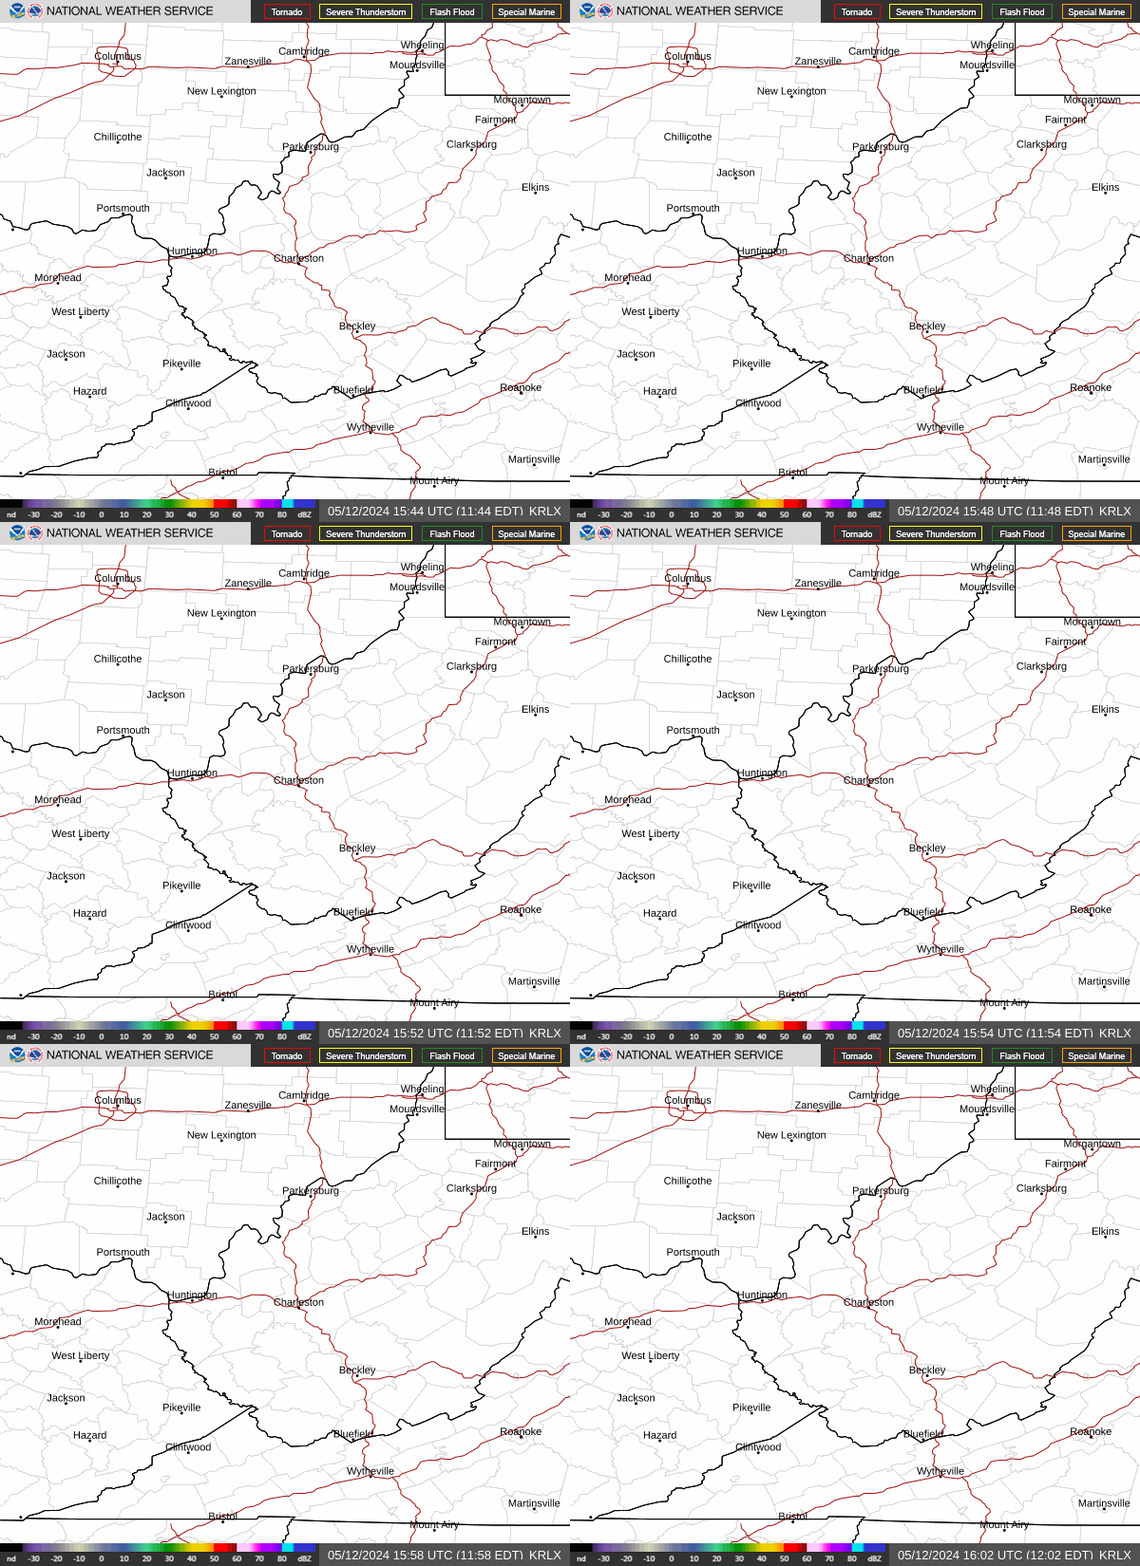
Source: National Weather Service radar, station KRLX. The loop is served live by the NWS and shows its own frame times.
Weather forecast Official NWS
Source: National Weather Service point forecast, updated Oct 16, 7:48 PM EDT.
About USGS gauge 03192000 Historical record
| Item | Value |
|---|---|
| USGS site name | GAULEY RIVER ABOVE BELVA, WV |
| Site type | Stream |
| Agency | U.S. Geological Survey |
| County and state | Nicholas County, West Virginia |
| Drainage area | 1,316 sq mi |
| Altitude | 669 ft (NAVD88) |
| Hydrologic unit code | 050500050809 |
| Coordinates | 38.2334, -81.1809 |
| Daily mean flow record | Oct 20, 1928 to Oct 15, 2026 |
| Instantaneous flow record | Oct 1, 1996 to Oct 16, 2026 |
| Instantaneous gage height record | Jun 15, 2026 to Oct 16, 2026 |
| Annual peaks on file | 98, 1918 to 2025 |
Source: USGS Water Data API monitoring-locations and time-series-metadata, fetched Oct 16, 10:12 PM EDT.
Sources and method
- Forecasts, alerts and observations: National Weather Service. NWS material is not subject to copyright. Terms
- Data: U.S. Geological Survey. Terms
- Map services and data available from U.S. Geological Survey, National Geospatial Program. Terms
- Rain estimates and radar: NOAA and National Weather Service. Terms
USGS daily statistics, downloaded 2026-10-12
Percentile method: trailing 24 h mean vs USGS daily percentiles for calendar date 10-16.
Percentile is estimated from USGS published daily percentiles. Readings are provisional until USGS reviews them. Not endorsed by USGS, NOAA or the National Weather Service. Not for navigation or safety-of-life decisions; the absence of an alert is not a statement that conditions are safe.