South Platte River below Brush Creek near Trumbull, CO: water level and flow
USGS gauge 06701900 · observed Nov 19, 5:45 PM MST · 36 min old ·
The river here is typical for Nov 19 and steady.
91 cfsTypical for Nov 19no change in 6 hNo active NWS alerts
Charts, tables and comparisons below are as of the page build, Nov 19, 6:20 PM MST.
More
A year earlier, on Nov 19, 2025: 146 cfs (USGS daily mean).Estimated from the trailing 24 h mean (91 cfs) against 24 years of USGS daily statistics for Nov 19. About 31 dams upstream (our estimate: EPA StreamCat’s density of National Inventory of Dams entries in this watershed, times the drainage area) may have changed flows during this record.cfs = cubic feet of water passing the gauge each second. Gage height is the gauge’s own scale, not water depth. Glossary
More
Flow 24 h earlier: 91 cfs.Not available for this gauge: clarity (no USGS turbidity or water-quality sensor at this gauge).
Government data, shown with the time it was observed or issued. It is not a flood warning, and it does not decide for you: no alert does not mean conditions are safe. Disclaimer
What the water is like now
How deep and wide the river is here Historical record#
Source
Source: USGS Water Data API channel measurements (hydrographer site visits within a mile of the gauge; the main channel of each visit), fetched Nov 14, 8:09 PM MST. Average depth = area ÷ width, our math. Credit: Data: U.S. Geological Survey.
About 1 ft deep on average at a flow like today's (91 cfs): on Oct 8, 2026, at 93 cfs, USGS measured the river 70 ft wide with an average depth of 1.0 ft (at the gauge). An average across the whole channel (area divided by width): pools and the main channel are deeper, edges shallower, and depth changes with the flow.
All 10 recent measurements
| Date | Flow | Average depth | Width |
|---|---|---|---|
| Oct 8, 2026 | 93 cfs | 1.0 ft | 70 ft |
| Aug 21, 2026 | 170 cfs | 1.2 ft | 82 ft |
| Jun 29, 2026 | 201 cfs | 1.3 ft | 82 ft |
| May 22, 2026 | 122 cfs | 1.0 ft | 75 ft |
| Apr 3, 2026 | 141 cfs | 1.0 ft | 81 ft |
| Feb 9, 2026 | 157 cfs | 1.1 ft | 82 ft |
| Jan 2, 2026 | 123 cfs | 0.9 ft | 80 ft |
| Nov 17, 2025 | 150 cfs | 1.1 ft | 83 ft |
| Aug 1, 2025 | 258 cfs | 1.4 ft | 84 ft |
| Jun 18, 2025 | 126 cfs | 1.0 ft | 80 ft |
How fast the water moves here Historical record#
Source
Source: USGS Water Data API channel measurements (hydrographer site visits within a mile of the gauge, main channel, last 20 years) at flows within 25% of the latest reading, 91 cfs. Mean velocity is the flow divided by the channel's cross-section area at one spot on one day; the times are our arithmetic (distance divided by that speed), not a trip time for any stretch.
At flows like today's, the water here has moved about 0.9 to 0.9 mph (1.2 to 1.4 ft/s, average across the channel, measured by USGS on 4 visits at 93 to 111 cfs). The main current and the surface run faster than the average; pools, eddies and the edges run slower, and wind and stops add time.
| Distance | Time drifting at that speed |
|---|---|
| 1 mile | 1 h 03 min to 1 h 10 min |
| 3 miles | 3 h 10 min to 3 h 31 min |
| 5 miles | 5 h 17 min to 5 h 52 min |
| 10 miles | 10 h 33 min to 11 h 44 min |
Weather at the river
Hourly weather below Brush Creek near Trumbull, next 24 hours Official NWS#
Source
Source: National Weather Service gridpoint forecast, updated Nov 19, 11:45 AM MST; chance of rain or snow from the NWS hourly point forecast. Hours are gauge-local; each row covers 3 hours and every hour is one tap below. How this table is built. Credit: Forecasts, alerts and observations: National Weather Service. NWS material is not subject to copyright.
Thunderstorms: none in the National Weather Service forecast for the next 24 hours.
Next 24 h: 35 to 57°F · gusts to 48 mph (10 AM) · rain or snow chance up to 2%.
| Time | Temp | Rain % | Wind mph | Sky |
|---|---|---|---|---|
| Thu 6 PM | 45°F | 0 | ↑ 12–21 | Mostly Cloudy |
| 9 PM | 41°F | 0 | ↑ 15–24 | Mostly Clear |
| Fri 12 AM | 37°F | 0 | ↑ 16–26 | Mostly Clear |
| 3 AM | 36°F | 0 | ↑ 20–32 | Mostly Clear |
| 6 AM | 35°F | 2 | ↑ 28–46 | Sunny |
| 9 AM | 43°F | 2 | ↑ 29–48 | Sunny |
| 12 PM | 55°F | 1 | ↑ 29–47 | Sunny |
| 3 PM | 55°F | 1 | ↑ 24–40 | Sunny |
Every hour
| Time | Temp | Rain % | Wind mph | Sky |
|---|---|---|---|---|
| Thu 6 PM | 45°F | 0 | ↑ 10–18 | Mostly Cloudy |
| 7 PM | 44°F | 0 | ↑ 12–21 | Partly Cloudy |
| 8 PM | 43°F | 0 | ↑ 12–21 | Mostly Clear |
| 9 PM | 41°F | 0 | ↑ 13–21 | Mostly Clear |
| 10 PM | 39°F | 0 | ↑ 14–23 | Mostly Clear |
| 11 PM | 38°F | 0 | ↑ 15–24 | Mostly Clear |
| Fri 12 AM | 37°F | 0 | ↑ 15–25 | Mostly Clear |
| Fri 1 AM | 36°F | 0 | ↑ 16–26 | Mostly Clear |
| Fri 2 AM | 37°F | 0 | ↑ 16–26 | Mostly Clear |
| 3 AM | 36°F | 0 | ↑ 17–28 | Mostly Clear |
| 4 AM | 36°F | 0 | ↑ 18–29 | Mostly Clear |
| 5 AM | 36°F | 0 | ↑ 20–32 | Mostly Clear |
| 6 AM | 35°F | 0 | ↑ 22–36 | Sunny |
| 7 AM | 35°F | 0 | ↑ 25–41 | Sunny |
| 8 AM | 38°F | 2 | ↑ 28–46 | Sunny |
| 9 AM | 43°F | 2 | ↑ 29–47 | Sunny |
| 10 AM | 48°F | 2 | ↑ 29–48 | Sunny |
| 11 AM | 54°F | 1 | ↑ 29–48 | Sunny |
| 12 PM | 55°F | 1 | ↑ 29–47 | Sunny |
| 1 PM | 56°F | 1 | ↑ 28–46 | Sunny |
| 2 PM | 57°F | 1 | ↑ 26–44 | Sunny |
| 3 PM | 55°F | 1 | ↑ 24–40 | Sunny |
| 4 PM | 53°F | 1 | ↑ 22–36 | Sunny |
| 5 PM | 47°F | 0 | ↑ 18–31 | Sunny |
7-day weather below Brush Creek near Trumbull Official NWS#
Source
Source: National Weather Service point forecast, updated Nov 19, 11:45 AM MST. Each card is one day: the daytime period and the night after it (high / low, and the chance of rain or snow for each).
Every NWS forecast period, in full
| Period | Temp | Wind | Rain or snow | Forecast |
|---|---|---|---|---|
| Tonight | 35°F | SSW 10 to 20 mph | 0% | Mostly clear, with a low around 35. South southwest wind 10 to 20 mph, with gusts as high as 32 mph. |
| Friday | 57°F | SW 18 to 29 mph | 2% | Sunny. High near 57, with temperatures falling to around 47 in the afternoon. Southwest wind 18 to 29 mph, with gusts as high as 48 mph. |
| Friday Night | 26°F | Calm | 41% | A chance of snow showers after 2am. Partly cloudy, with a low around 26. Southwest wind 0 to 16 mph, with gusts as high as 28 mph. Chance of precipitation is 40%. New snow accumulation of less than half an inch possible. |
| Saturday | 47°F | Calm | 41% | A chance of snow showers before 5pm. Mostly sunny, with a high near 47. Northwest wind 0 to 7 mph. Chance of precipitation is 40%. New snow accumulation of less than half an inch possible. |
| Saturday Night | 21°F | WSW 3 to 7 mph | 0% | Mostly clear, with a low around 21. West southwest wind 3 to 7 mph. |
| Sunday | 52°F | SW 5 to 10 mph | 0% | Mostly sunny, with a high near 52. |
| Sunday Night | 24°F | SW 3 to 9 mph | 0% | Partly cloudy, with a low around 24. |
| Monday | 49°F | SE 3 to 8 mph | 35% | A chance of snow showers after 5pm. Partly sunny, with a high near 49. |
| Monday Night | 22°F | Calm | 35% | A chance of snow showers. Mostly cloudy, with a low around 22. New snow accumulation of less than half an inch possible. |
| Tuesday | 46°F | E 1 to 9 mph | 16% | A slight chance of snow showers before 11am. Mostly sunny, with a high near 46. |
| Tuesday Night | 22°F | S 6 mph | 7% | Partly cloudy, with a low around 22. |
| Wednesday | 53°F | SW 7 mph | 8% | Mostly sunny, with a high near 53. |
| Wednesday Night | 27°F | WSW 1 to 5 mph | 17% | A slight chance of snow showers between 11pm and 5am. Mostly cloudy, with a low around 27. |
| Thanksgiving Day | 51°F | NW 1 to 12 mph | 27% | A chance of snow showers after 11am. Partly sunny, with a high near 51. |
Air conditions at weather station K4BM Weather station#
Source
Source: National Weather Service station K4BM, observed Nov 19, 5:35 PM MST.
NWS station K4BM (Wilkerson Pass), 21 mi from the gauge, observed Nov 19, 5:35 PM MST.
| Measure | Value |
|---|---|
| Air temperature | 32 °F |
| Wind | SSE 13 mph |
| Gusts | 17 mph |
| Pressure | 30.18 inHg |
| Visibility | 10 mi |
Air quality now EPA monitor#
Source
Source: EPA AirNow NowCast AQI, reporting agency Colorado Department of Public Health and Environment, nearest monitor to the gauge; preliminary data, subject to change. Fetched Nov 19, 4:00 PM MST. Credit: Air quality: EPA AirNow and the reporting agency named on the row (preliminary data).
Moderate: AQI 60 of 500 (PM10, EPA)
| Pollutant and monitor | AQI (of 500) | EPA category |
|---|---|---|
| PM2.5 Chatfield Park - 11500 N. Roxborough Park Rd., 21 mi from the gauge | 36 | Good |
| Ozone Chatfield Park - 11500 N. Roxborough Park Rd., 21 mi from the gauge | 20 | Good |
| PM10 Adams-Birch, 42 mi from the gauge | 60 | Moderate |
All observed Nov 19, 3:00 PM MST.
Recent rain at the gauge location Official NWS#
Source
Source: NWS River Forecast Center multisensor precipitation estimate, about 2.5-mile grid at the gauge location, fetched Nov 19, 6:00 PM MST. Estimate, not a gauge at the stream. Each window is a separate NWS product with its own end time (hourly and daily products), so a longer window can end earlier than a shorter one and show less rain. Credit: Rain estimates and radar: NOAA and National Weather Service.
Radar Official NWS#
Source
Source: National Weather Service radar, station KFTG. The loop is served live by the NWS and shows its own frame times.
Weather alerts
No active National Weather Service alerts were returned for this location. This is not a statement that conditions are safe.
Source
Source: National Weather Service alerts for the gauge location, fetched Nov 19, 6:15 PM MST.
Level and flow
Flow over time Live gauge#
Source
7 days: Source: USGS Water Data API (continuous values), observed to Nov 19, 5:45 PM MST. Flow in cfs. 30 days: Source: USGS daily mean flows (Water Data API), Oct 15, 2026 to Nov 13, 2026. Gaps are days without a published value; recent days are provisional. 12 months: Source: USGS daily mean flows (Water Data API), Nov 13, 2025 to Nov 13, 2026. Shaded band: 25th to 75th percentile of USGS daily statistics for each date; dashed: median. Earlier years: Source: USGS daily mean flows (Water Data API). Each line is the 50 days from Sep 25 to Nov 13, shifted to the same calendar dates in earlier years; gaps are days without a published value. Recent days are provisional.
7 days
Shaded: the typical range for each date (25th to 75th percentile of past years) · dashed line: the median.
30 days
Shaded: the typical range for each date (25th to 75th percentile of past years) · dashed line: the median.
12 months
Earlier years
2026 2025 2024 2023
| Year | Mean flow | Highest day |
|---|---|---|
| 2026 | 86 cfs | 107 cfs |
| 2025 | 151 cfs | 172 cfs |
| 2024 | 180 cfs | 291 cfs |
| 2023 | 147 cfs | 249 cfs |
Gage height Live gauge#
Source
Source: USGS Water Data API (continuous gage height), observed to Nov 19, 5:45 PM MST.
The National Weather Service publishes no flood stages for this gauge, so none are drawn.
Solid line: USGS readings.
Every stage and reading in a table
| Measure | Gage height | Note |
|---|---|---|
| Latest USGS gage height | 3.12 ft | Nov 19, 5:45 PM MST |
Rate of rise and fall Live gauge#
Source
Source: computed from USGS continuous readings (Water Data API) to Nov 19, 5:45 PM MST. How the changes are computed.
Getting on the water
Recreation sites within 15 miles Agency data#
Source
Source: Recreation.gov Recreation Information Database (RIDB), federal sites only; state and private ramps are not in it. Fees, reservations, addresses, directions and descriptions are Recreation.gov's own words. Distances are straight-line from the gauge. Fetched Nov 19, 2:01 AM MST. Credit: Recreation sites: Recreation.gov (RIDB).
12 federal sites within 15 miles, nearest Lone Rock Campground (CO) at 0.9 mi. Fees, reservations and directions are as Recreation.gov lists them.
| Site | Distance | Fees and reservations |
|---|---|---|
| Lone Rock Campground (CO) Campground · USDA Forest Service Activities: Boating, Fishing MoreAbout: Lone Rock Campground, located along the South Platte River, boasts spectacular views and top-notch fly fishing waters. Address: Pike National Forest, S.Platte Ranger Dist, CO Directions: From Denver, Colorado, take Highway 285 southwest to Pine Junction, Colorado. Turn south on Jefferson County 126 and travel 28 miles. Look for signs into campground. Email: jvalentine@goexplorus.com Phone: (303) 275-5610 | 0.9 mi | Fee not stated by Recreation.gov Recreation.gov lists it as reservable |
| Platte River Campground · USDA Forest Service Activities not listed MoreAbout: This location is available on a first-come, first-served basis only. Email: lhuckabay@goexplorus.com Phone: not listed | 2.7 mi | Fee not stated by Recreation.gov Recreation.gov lists it as reservable |
| Ouzel Campground · USDA Forest Service Activities not listed MoreAbout: This campground has 13 campsites (8 campsites are first come first served and 5 are reservable) available for tent camping only. Email: tbolton@goexplorus.com Phone: not listed | 4.6 mi | Fee not stated by Recreation.gov Recreation.gov lists it as reservable |
All 12 sites
| Site | Distance | Fees and reservations |
|---|---|---|
| Kelsey Campground Campground · USDA Forest Service Activities: Biking, Camping, Climbing MoreAbout: Kelsey is one of two campgrounds within the Buffalo Creek Recreation Area, about an hour's drive southwest of Denver, Colorado. Directions: From Denver, take Highway 285 southwest to Pine Junction and turn south on Jefferson County Road 126. Travel approximately 17 miles to the campground. Email: jvalentine@goexplorus.com Phone: (303) 275-5610 | 4.6 mi | Fee not stated by Recreation.gov Recreation.gov lists it as reservable |
| Devils Head Campground Campground · USDA Forest Service Activities not listed MoreEmail: jvalentine@goexplorus.com Phone: not listed | 6.3 mi | Fee not stated by Recreation.gov Recreation.gov lists it as reservable |
| Osprey (CO) Campground · USDA Forest Service Activities not listed MoreAbout: Great fishing in the South Platte River This campground has 13 campsites (8 campsites are first come first served and 5 are reservable) available for tent camping only. Email: lhuckabay@goexplorus.com Phone: not listed | 6.6 mi | Fee not stated by Recreation.gov Recreation.gov lists it as reservable |
| Meadows Group Campground Campground · USDA Forest Service Activities: Fishing MoreAbout: Meadows Group Campground offers a wonderful opportunity for groups to enjoy the great outdoors. Address: Pike National Forest., S.Platte Ranger Dist, CO Directions: From Denver, Colorado, take Highway 285 southwest to Pine Junction, turn south on Jefferson County 126 and travel 15 miles to Buffalo Creek. Turn right on Forest Road 550 and drive 5 miles to the Meadows Group Campground. Email: jvalentine@goexplorus.com Phone: (303) 275-5610 | 7.1 mi | Fee not stated by Recreation.gov Recreation.gov lists it as reservable |
| Buffalo Campground Campground · USDA Forest Service Activities: Fishing MoreAbout: Buffalo Campground is one of two facilities within the Buffalo Creek Recreation Area, about an hour's drive southwest of Denver, Colorado. Address: 28718 Redskin Creek Rd., Bailey, CO Directions: From Denver, travel southwest on Highway 285. Turn south on Jefferson County Road 126 and travel 15 miles. Turn right on Forest Road 550 and drive 5 miles to the campground. Email: lhuckabay@goexplorus.com Phone: (303) 275-5610 | 8.1 mi | Fee not stated by Recreation.gov Recreation.gov lists it as reservable |
| Flat Rocks Campground Campground · USDA Forest Service Activities not listed MoreEmail: jvalentine@goexplorus.com Phone: not listed | 8.4 mi | Fee not stated by Recreation.gov Recreation.gov lists it as reservable |
| Green Mountain Campground Campground · USDA Forest Service Activities not listed MoreEmail: jvalentine@goexplorus.com Phone: not listed | 8.5 mi | Fee not stated by Recreation.gov Recreation.gov lists it as reservable |
| Goose Creek Campground Campground · USDA Forest Service Activities not listed MoreEmail: jvalentine@goexplorus.com Phone: not listed | 9.6 mi | Fee not stated by Recreation.gov Recreation.gov lists it as reservable |
| Rampart Range Recreation Area Designated Dispersed Camping Campground · USDA Forest Service Activities: Camping, Climbing, Lookout Tower MoreAbout: The Rampart Range Recreation Area's Designated Dispersed Camping is operated by ExplorUS LLC. Email: jvalentine@goexplorus.com Phone: (303) 275-5610 | 10.6 mi | Fee not stated by Recreation.gov Recreation.gov lists it as reservable |
Text that several of these sites share on Recreation.gov (an office address, a booking note) is listed once, under the first site that has it.
Public land at this gauge Mapped layer#
Source
Source: USGS Protected Areas Database (PAD-US), within about half a mile of the gauge, downloaded Oct 31, 2026. Mapped land is not proof of legal access. Credit: Public land: USGS Gap Analysis Project, Protected Areas Database of the United States (PAD-US).
| Unit | Managed by | Public access |
|---|---|---|
| Pike National Forest | US Forest Service | Public land (mapped); river access not confirmed |
| South Platte River | Regional Water Districts | Public land (mapped); river access not confirmed |
| Deckers | Regional Water Districts | Closed |
Fish species recorded nearby Agency data#
Source
Source: GBIF.org occurrence records shared for reuse with credit (CC0 and CC BY), common names from ITIS, read Nov 13, 3:56 PM MST. Counts are records, not fish caught. Credit: GBIF.org occurrence data; dataset publishers named on the page; common names: ITIS.
2 fish species have records within 10 km since 2000. Most recorded: rainbow trout, brown trout.
| Fish (ITIS common names) | Scientific name | Records |
|---|---|---|
| rainbow trout, steelhead, redband trout | Oncorhynchus mykiss | 2 |
| brown trout | Salmo trutta | 2 |
Records come from surveys, museum collections and checked public sightings, and can be from other water within 10 km. Largest sources here: USGS Nonindigenous Aquatic Species database (4 records).
Moon phases Agency data#
Source
Source: U.S. Naval Observatory, Astronomical Applications Department, moon phases, read Nov 13, 3:56 PM MST. USNO gives the times in UT; local time is our conversion. Credit: Data: U.S. Naval Observatory, Astronomical Applications Department.
Next full moon: Nov 24, 7:53 AM MST; next new moon: Dec 8, 5:52 PM MST.
| Phase | Date and time |
|---|---|
| Full Moon | Nov 24, 7:53 AM MST |
| Last Quarter | Nov 30, 11:08 PM MST |
| New Moon | Dec 8, 5:52 PM MST |
| First Quarter | Dec 16, 10:42 PM MST |
River forecast
NOAA National Water Model, next 15 hours Model guidance#
Source
Source: NOAA National Water Model, reach 190643, run Nov 19, 3:00 PM MST. Model guidance, not an official forecast and not a measurement. Credit: National Water Model guidance: NOAA.
The model starts at 228 cfs while the gauge measured 91 cfs (+152%): read the model for the direction it shows, not its numbers.
| Time (gauge-local) | Modeled flow |
|---|---|
| Nov 19, 6:00 PM MST | 228 cfs |
| Nov 19, 9:00 PM MST | 429 cfs |
| Nov 20, 12:00 AM MST | 517 cfs |
| Nov 20, 3:00 AM MST | 540 cfs |
| Nov 20, 6:00 AM MST | 546 cfs |
| Nov 20, 9:00 AM MST | 546 cfs |
NOAA National Water Model, next 4 days (ensemble mean) Model guidance Older than 12 h#
Source
Source: NOAA National Water Model medium-range ensemble mean, reach 190643, run Nov 18, 11:00 PM MST. Model guidance, not an official forecast and not a measurement; error is larger on small basins.
The model starts at 547 cfs while the gauge measured 91 cfs (+505%): read the model for the direction it shows, not its numbers.
| Time (gauge-local) | Modeled flow (ensemble mean) |
|---|---|
| Nov 19, 6:00 PM MST | 547 cfs |
| Nov 20, 6:00 AM MST | 547 cfs |
| Nov 20, 6:00 PM MST | 546 cfs |
| Nov 21, 6:00 AM MST | 545 cfs |
| Nov 21, 6:00 PM MST | 543 cfs |
| Nov 22, 6:00 AM MST | 542 cfs |
| Nov 22, 6:00 PM MST | 541 cfs |
| Nov 23, 6:00 AM MST | 540 cfs |
| Nov 23, 6:00 PM MST | 539 cfs |
Rain and longer outlook
Measured daily rain at nearby weather stations Weather station#
Source
Source: NOAA Regional Climate Centers ACIS, daily precipitation at the nearest county weather stations, fetched Nov 19, 2:01 AM MST. Each value is a 24-hour total for the station's observation day; trace means less than 0.01 in. Where ACIS lists two reports for one station, the first is shown. Credit: Station climate data: NOAA Regional Climate Centers, ACIS (preliminary).
Strontia Springs Dam, 13 mi away: no measurable rain over the last 6 days.
Each date is one station observation day, which often ends in the morning, so it does not line up with the rain totals for the gauge location above.
| Day | Strontia Springs Dam (13 mi away) | 6.8 mi south of Sedalia (15 mi away) | 3.5 mi south-southeast of Sedalia (17 mi away) |
|---|---|---|---|
| Nov 19 | not reported | not reported | not reported |
| Nov 18 | 0.00 in | 0.00 in | 0.00 in |
| Nov 17 | 0.00 in | 0.00 in | 0.00 in |
| Nov 16 | 0.00 in | 0.00 in | 0.00 in |
| Nov 15 | 0.00 in | 0.00 in | trace |
| Nov 14 | 0.00 in | 0.00 in | 0.00 in |
| Nov 13 | 0.00 in | 0.00 in | 0.00 in |
Forecast rain totals Official NWS#
Source
Source: National Weather Service gridpoint quantitative precipitation forecast at the gauge location, updated Nov 19, 11:45 AM MST. A forecast, not a measurement.
| Window | Forecast rain |
|---|---|
| Next 6 hours | 0.00 in |
| Next 12 hours | 0.00 in |
| Next 24 hours | 0.00 in |
| Next 48 hours | 0.02 in |
| Next 72 hours | 0.02 in |
| Next 7 days | 0.04 in |
Snow water equivalent at nearby SNOTEL stations Weather station#
Source
Source: USDA Natural Resources Conservation Service SNOTEL stations within 37 miles of the gauge (AWDB web service), fetched Nov 19, 2:00 AM MST. Provisional data; stations may not drain to this gauge. Credit: Snow data: U.S. Department of Agriculture, Natural Resources Conservation Service.
Each station: distance, elevation and date
| Station | Snow water now | Median for this date | Date |
|---|---|---|---|
| Glen Cove 28 mi away, 11,410 ft up | 0.9 in | 180% of 0.5 in | Nov 18, 2026 |
| Echo Lake 34 mi away, 10,660 ft up | 0.1 in | 7% of 1.4 in | Nov 18, 2026 |
Temperature and precipitation outlooks Official NWS#
Source
Source: NOAA Climate Prediction Center outlooks at the gauge location (6 to 10 day for Nov 24 to Nov 28, issued Nov 18; 8 to 14 day for Nov 26 to Dec 2, issued Nov 18). A probability is the chance of the leaning category (above, near or below normal) for the whole period, not an amount. Credit: Outlook: NOAA Climate Prediction Center.
Camera at the gauge
Camera at the gauge, newest image Agency data#
Source
Source: U.S. Geological Survey HIVIS camera (NIMS API), newest image at build time; the image file is served by USGS. Fetched Nov 18, 9:00 PM MST. Credit: Camera images: U.S. Geological Survey, HIVIS.
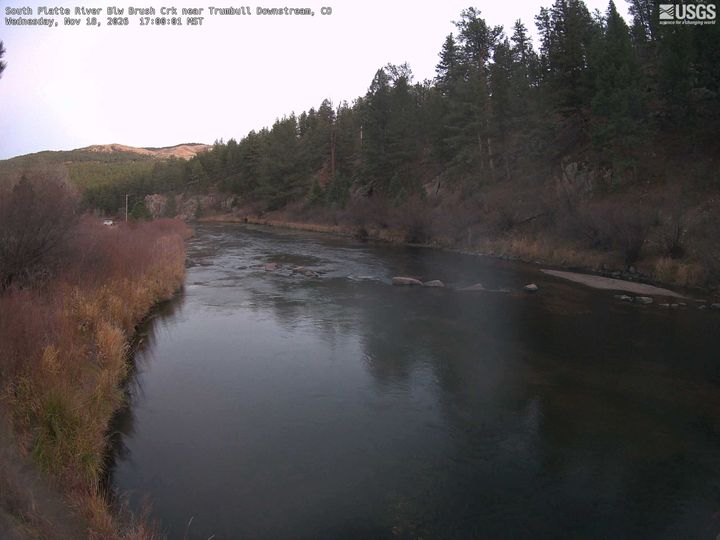
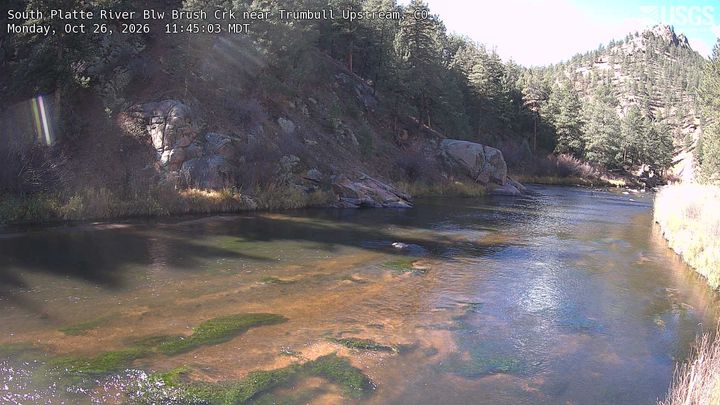
How today compares with past years
Key facts Historical record#
Source
Sources: USGS Water Data API and USGS annual peak streamflow.
- South Platte River below Brush Creek near Trumbull is USGS gauge 06701900 in Douglas County, Colorado; it drains 2,028 square miles.
- USGS daily flow records here run from Jul 19, 2002 to Nov 12, 2026.
- Highest annual peak flow on USGS file: 2,360 cfs on Jun 18, 2015 (24 annual peaks, 2002 to 2024).
Flow over recent weeks Historical record#
Source
Source: USGS daily mean flow for each date through Nov 13, 2026 compared with USGS daily statistics for those same dates; the percentile shown is the average of the daily percentiles over the window.
Past 7 days: 29th percentile, typical for this date · Past 28 days: 33rd percentile, typical for this date
Each day is placed among past years for that date and the placings are averaged. The month-to-date rank below instead compares this month's mean flow with each year's mean for the same dates, so the two can land in different bands.
Compared with this gauge’s record Historical record#
Source
Source: USGS daily mean flows (Water Data API), 2002 to 2026 (8,884 days), data through Nov 13, 2026. Percentiles are USGS daily statistics. Recent days are provisional.
How often the flow reaches each level, 2002 to 2015 Historical record#
Source
Source: USGS StreamStats gage statistics (flow-duration statistics), 10/1/2002 to 9/30/2015. The flow equalled or exceeded on that share of days over the period. Fetched Nov 19, 2:00 AM MST.
| Flow level | How often |
|---|---|
| Flow is at least 634 cfs | on 5% of all days on record |
| Flow is at least 468 cfs | on 10% of all days on record |
| Flow is at least 264 cfs | on 25% of all days on record |
| Flow is at least 153 cfs | on 50% of all days on record |
| Flow is at least 98 cfs | on 75% of all days on record |
| Flow is at least 68 cfs | on 90% of all days on record |
| Flow is at least 58 cfs | on 95% of all days on record |
Flood record and history2 sections: Largest annual peaks · The biggest floods here, day by day
Largest annual peaks Historical record#
Source
Source: USGS annual peak streamflow (Water Data API), 24 annual peaks, 2002 to 2024. A water year's peak is its highest instantaneous flow. Gage height at older peaks can be on a different datum. Decades with fewer than 5 peaks are left out.
The yearly high here has come most often in July: 8 of 24 water years, then June (5). In other years it came in other months; this is the record, not a forecast.
Ten largest peaks of record
| Date | Peak flow | Gage height at peak |
|---|---|---|
| Jun 18, 2015 | 2,360 cfs | 7.09 ft |
| Jul 8, 2006 | 2,290 cfs | 7.02 ft |
| Jul 22, 2009 | 1,750 cfs | 6.04 ft |
| Aug 6, 2004 | 1,320 cfs | 5.59 ft |
| May 10, 2007 | 1,080 cfs | 5.60 ft |
| Jul 8, 2019 | 1,020 cfs | 5.27 ft |
| Jun 19, 2024 | 965 cfs | 5.50 ft |
| Jul 11, 2011 | 877 cfs | 4.73 ft |
| Jun 10, 2014 | 873 cfs | 5.20 ft |
| May 30, 2003 | 858 cfs | 4.93 ft |
Five most recent annual peaks
| Date | Peak flow | Gage height at peak |
|---|---|---|
| Oct 1, 2024 | 328 cfs | 4.31 ft |
| Jun 19, 2024 | 965 cfs | 5.50 ft |
| Jun 18, 2023 | 644 cfs | 4.62 ft |
| Aug 29, 2022 | 491 cfs | 4.38 ft |
| Jul 31, 2021 | 572 cfs | 4.46 ft |
Median annual peak by decade (calendar year of the peak date)
| Decade | Peaks on file | Median peak | Largest peak |
|---|---|---|---|
| 2000s | 8 | 969 cfs | 2,290 cfs |
| 2010s | 10 | 803 cfs | 2,360 cfs |
| 2020s | 6 | 608 cfs | 965 cfs |
The biggest floods here, day by day Historical record#
Source
Source: USGS annual peak streamflow (instantaneous peaks; peaks USGS codes as historic, a daily mean, a dam failure, a lower or upper bound, or with an unknown date are left out) and USGS daily mean flows (Water Data API), from 3 days before to 10 days after each peak; floods before the daily record began are skipped. A daily mean averages the whole day, so it runs below the instantaneous peak. Two peaks within 14 days count as one flood. Days are counted inside that 14-day window.
The largest flood in this gauge's daily record peaked at 2,360 cfs on Jun 18, 2015. For each of the biggest floods: how high the daily flow ran and how long it stayed above half the peak.
| Flood | Peak (USGS) | Highest daily mean | Days above half the peak | Back under half the peak |
|---|---|---|---|---|
| Jun 18, 2015 | 2,360 cfs | 2,190 cfs on Jun 17 | 14 | not by Jun 28 |
| Jul 8, 2006 | 2,290 cfs | 537 cfs on Jul 10 | 0 | Jul 9 |
| Jul 22, 2009 | 1,750 cfs | 414 cfs on Jul 26 | 0 | Jul 23 |
Daily values, measurements and rating3 sections: Daily mean flow · USGS field measurements · Gage height to flow rating
Daily mean flow Live gauge#
Source
Source: USGS Water Data API (daily values where USGS has published them; otherwise the mean of continuous readings on that gauge-local date, shown only with at least 80% of expected readings).
| Date (gauge-local) | Mean flow | Note |
|---|---|---|
| Nov 19, 2026 | – | Partial day (72 of about 96 readings) |
| Nov 18, 2026 | 91 cfs | Mean of readings, not yet published by USGS |
| Nov 17, 2026 | 91 cfs | Mean of readings, not yet published by USGS |
| Nov 16, 2026 | 91 cfs | Mean of readings, not yet published by USGS |
| Nov 15, 2026 | 91 cfs | Mean of readings, not yet published by USGS |
| Nov 14, 2026 | 91 cfs | Mean of readings, not yet published by USGS |
| Nov 13, 2026 | 91 cfs | |
| Nov 12, 2026 | 91 cfs | |
| Nov 11, 2026 | 91 cfs |
USGS field measurements Historical record#
Source
Source: USGS Water Data API field measurements, the 10 most recent site-visit measurements with a flow value, fetched Nov 14, 8:09 PM MST. The measurement quality shown is the USGS measurement rating as published.
| Date | Measured flow | Gage height | USGS measurement quality |
|---|---|---|---|
| Oct 8, 2026 | 93 cfs | 3.19 ft | Poor |
| Aug 21, 2026 | 170 cfs | 3.53 ft | Poor |
| Jun 29, 2026 | 201 cfs | 3.62 ft | Poor |
| May 22, 2026 | 122 cfs | 3.24 ft | Poor |
| Apr 3, 2026 | 141 cfs | 3.33 ft | Poor |
| Feb 9, 2026 | 157 cfs | 3.42 ft | Poor |
| Jan 2, 2026 | 123 cfs | 3.25 ft | Poor |
| Nov 17, 2025 | 150 cfs | 3.45 ft | Poor |
| Aug 1, 2025 | 258 cfs | 3.87 ft | Poor |
| Jun 18, 2025 | 126 cfs | 3.36 ft | Poor |
Gage height to flow rating Historical record#
Source
Source: USGS rating table for the gauge, thinned for display, fetched Nov 19, 2:01 AM MST. Ratings are provisional and change with the channel.
Line: current USGS rating, gage height (ft, horizontal) to flow (cfs, vertical). ● latest reading, 3.12 ft and 91 cfs.
Watershed, water quality and land4 sections: E. coli samples on this stretch · Drought Monitor, Douglas County · State water quality assessments near the gauge · Upstream watershed characteristics
E. coli samples on this stretch
No E. coli samples on file for this stretch in the last 3 years (Water Quality Portal).
Source
Source: Water Quality Portal (EPA, USGS and state agencies), E. coli results at stations on this river within 9 miles upstream and downstream, found by USGS NLDI river navigation, fetched Nov 14, 8:00 PM MST. Credit: Water samples: Water Quality Portal (EPA, USGS, states).
Drought Monitor, Douglas County U.S. Drought Monitor#
Source
Source: U.S. Drought Monitor weekly county statistics (National Drought Mitigation Center, USDA, NOAA), map date Nov 10, 2026, fetched Nov 19, 2:00 AM MST. Credit: The U.S. Drought Monitor is jointly produced by the National Drought Mitigation Center at the University of Nebraska-Lincoln, the United States Department of Agriculture, the National Oceanic and Atmospheric Administration and the National Aeronautics and Space Administration. Map / Data courtesy of NDMC.
Source figures are cumulative: each row counts the county area in that category or any worse one, so the rows are not shares that add to 100%.
| Category | Share of county area, week of Nov 10, 2026 | Previous week |
|---|---|---|
| No drought | 0.0% | 0.0% |
| Abnormally dry or worse (D0 to D4) | 100.0% | 100.0% |
| Moderate drought or worse (D1 to D4) | 100.0% | 100.0% |
| Severe drought or worse (D2 to D4) | 92.5% | 92.5% |
| Extreme drought or worse (D3 to D4) | 39.1% | 39.1% |
| Exceptional drought (D4) | 0.0% | 0.0% |
State water quality assessments near the gauge Agency data#
Source
Source: EPA ATTAINS assessment units within about a quarter mile of the gauge, as reported by the state, fetched Nov 19, 2:00 AM MST. Values are the state's assessment, quoted. Credit: Water quality assessments and watershed data: U.S. Environmental Protection Agency.
‘Not supporting’ means the state rates this water below its goals for some use; it is not a swim advisory. This is the state's Clean Water Act designated-use assessment (a multi-year regulatory status), not a current bacteria or recreation advisory.
| Water (EPA report) | State rating | Cleanup plan | Assessed |
|---|---|---|---|
| South Platte River, all tributaries. | Fully Supporting | N | 2024 |
| South Platte River, mainstem. | Fully Supporting | N | 2024 |
Upstream watershed characteristics Agency data#
Source
Source: U.S. EPA StreamCat, watershed-wide metrics; land cover from the 2019 National Land Cover Database. Static values, fetched Nov 19, 2:01 AM MST.
Sources and method17 data sources, how the percentile is calculated, disclaimer
- USGS Water Data API, NLDI, daily statistics. Terms
- National Weather Service api.weather.gov. Terms
- EPA AirNow current air quality (airnowapi.org). Terms
- NOAA River Forecast Center precipitation estimates and NWS radar imagery. Terms
- Recreation.gov RIDB (federal recreation facilities). Terms
- USGS PAD-US public land. Terms
- GBIF.org occurrence search API (fish records, CC0 and CC BY only), with US common names from ITIS (itis.gov web services). Terms
- U.S. Naval Observatory Astronomical Applications Department, Sun and Moon data for one day (aa.usno.navy.mil/api/rstt/oneday). Terms
- NOAA National Water Model guidance (via NWPS). Terms
- NOAA Regional Climate Centers ACIS. Terms
- USDA NRCS SNOTEL (AWDB web service). Terms
- NOAA Climate Prediction Center 8 to 14 day outlook (NWS map service). Terms
- USGS HIVIS gaging-station cameras (NIMS API). Terms
- Water Quality Portal (EPA, USGS, state agencies). Terms
- U.S. Drought Monitor. Terms
- EPA ATTAINS. Terms
- USGS The National Map (USGS Topo map service). Terms
USGS daily statistics, downloaded Nov 20, 2026
Percentile method: trailing 24-hour mean compared with USGS daily percentiles for Nov 19.
Percentile is estimated from USGS published daily percentiles. Readings are provisional until USGS reviews them. Not endorsed by USGS, NOAA or the National Weather Service. Not for navigation or safety-of-life decisions; the absence of an alert is not a statement that conditions are safe.